Customer Studio Analytics, including Performance metrics, are available as an add-on on Business tier plans.
You can only define Performance metrics on audiences built off sources that use the Lightning sync engine. Check out the audience snapshots section to learn more.
Overview
Suppose you've just built a new audience of users and deployed them to a campaign. The question becomes: how has my audience reacted to that new campaign? The Performance feature enables you to define success metrics and measure your audience against them, all within Hightouch.
With Performance, you can define success metrics such as:
- Revenue
- Number of subscription sign-ups
- Number of inactive users who've recently logged back in
You can then track how these metrics perform over time and compare them across audiences. Performance also works seamlessly with Hightouch Splits. You can set up an A/B test within Hightouch, see how each split group performs, and determine a winner.
Configure metrics
You can define metrics off of any event in your data schema. Metrics are defined on a parent-model basis, and you can enable them on any audience built off the parent model.
Prerequisites
To define a performance metric, you must fulfill these prerequisites first:
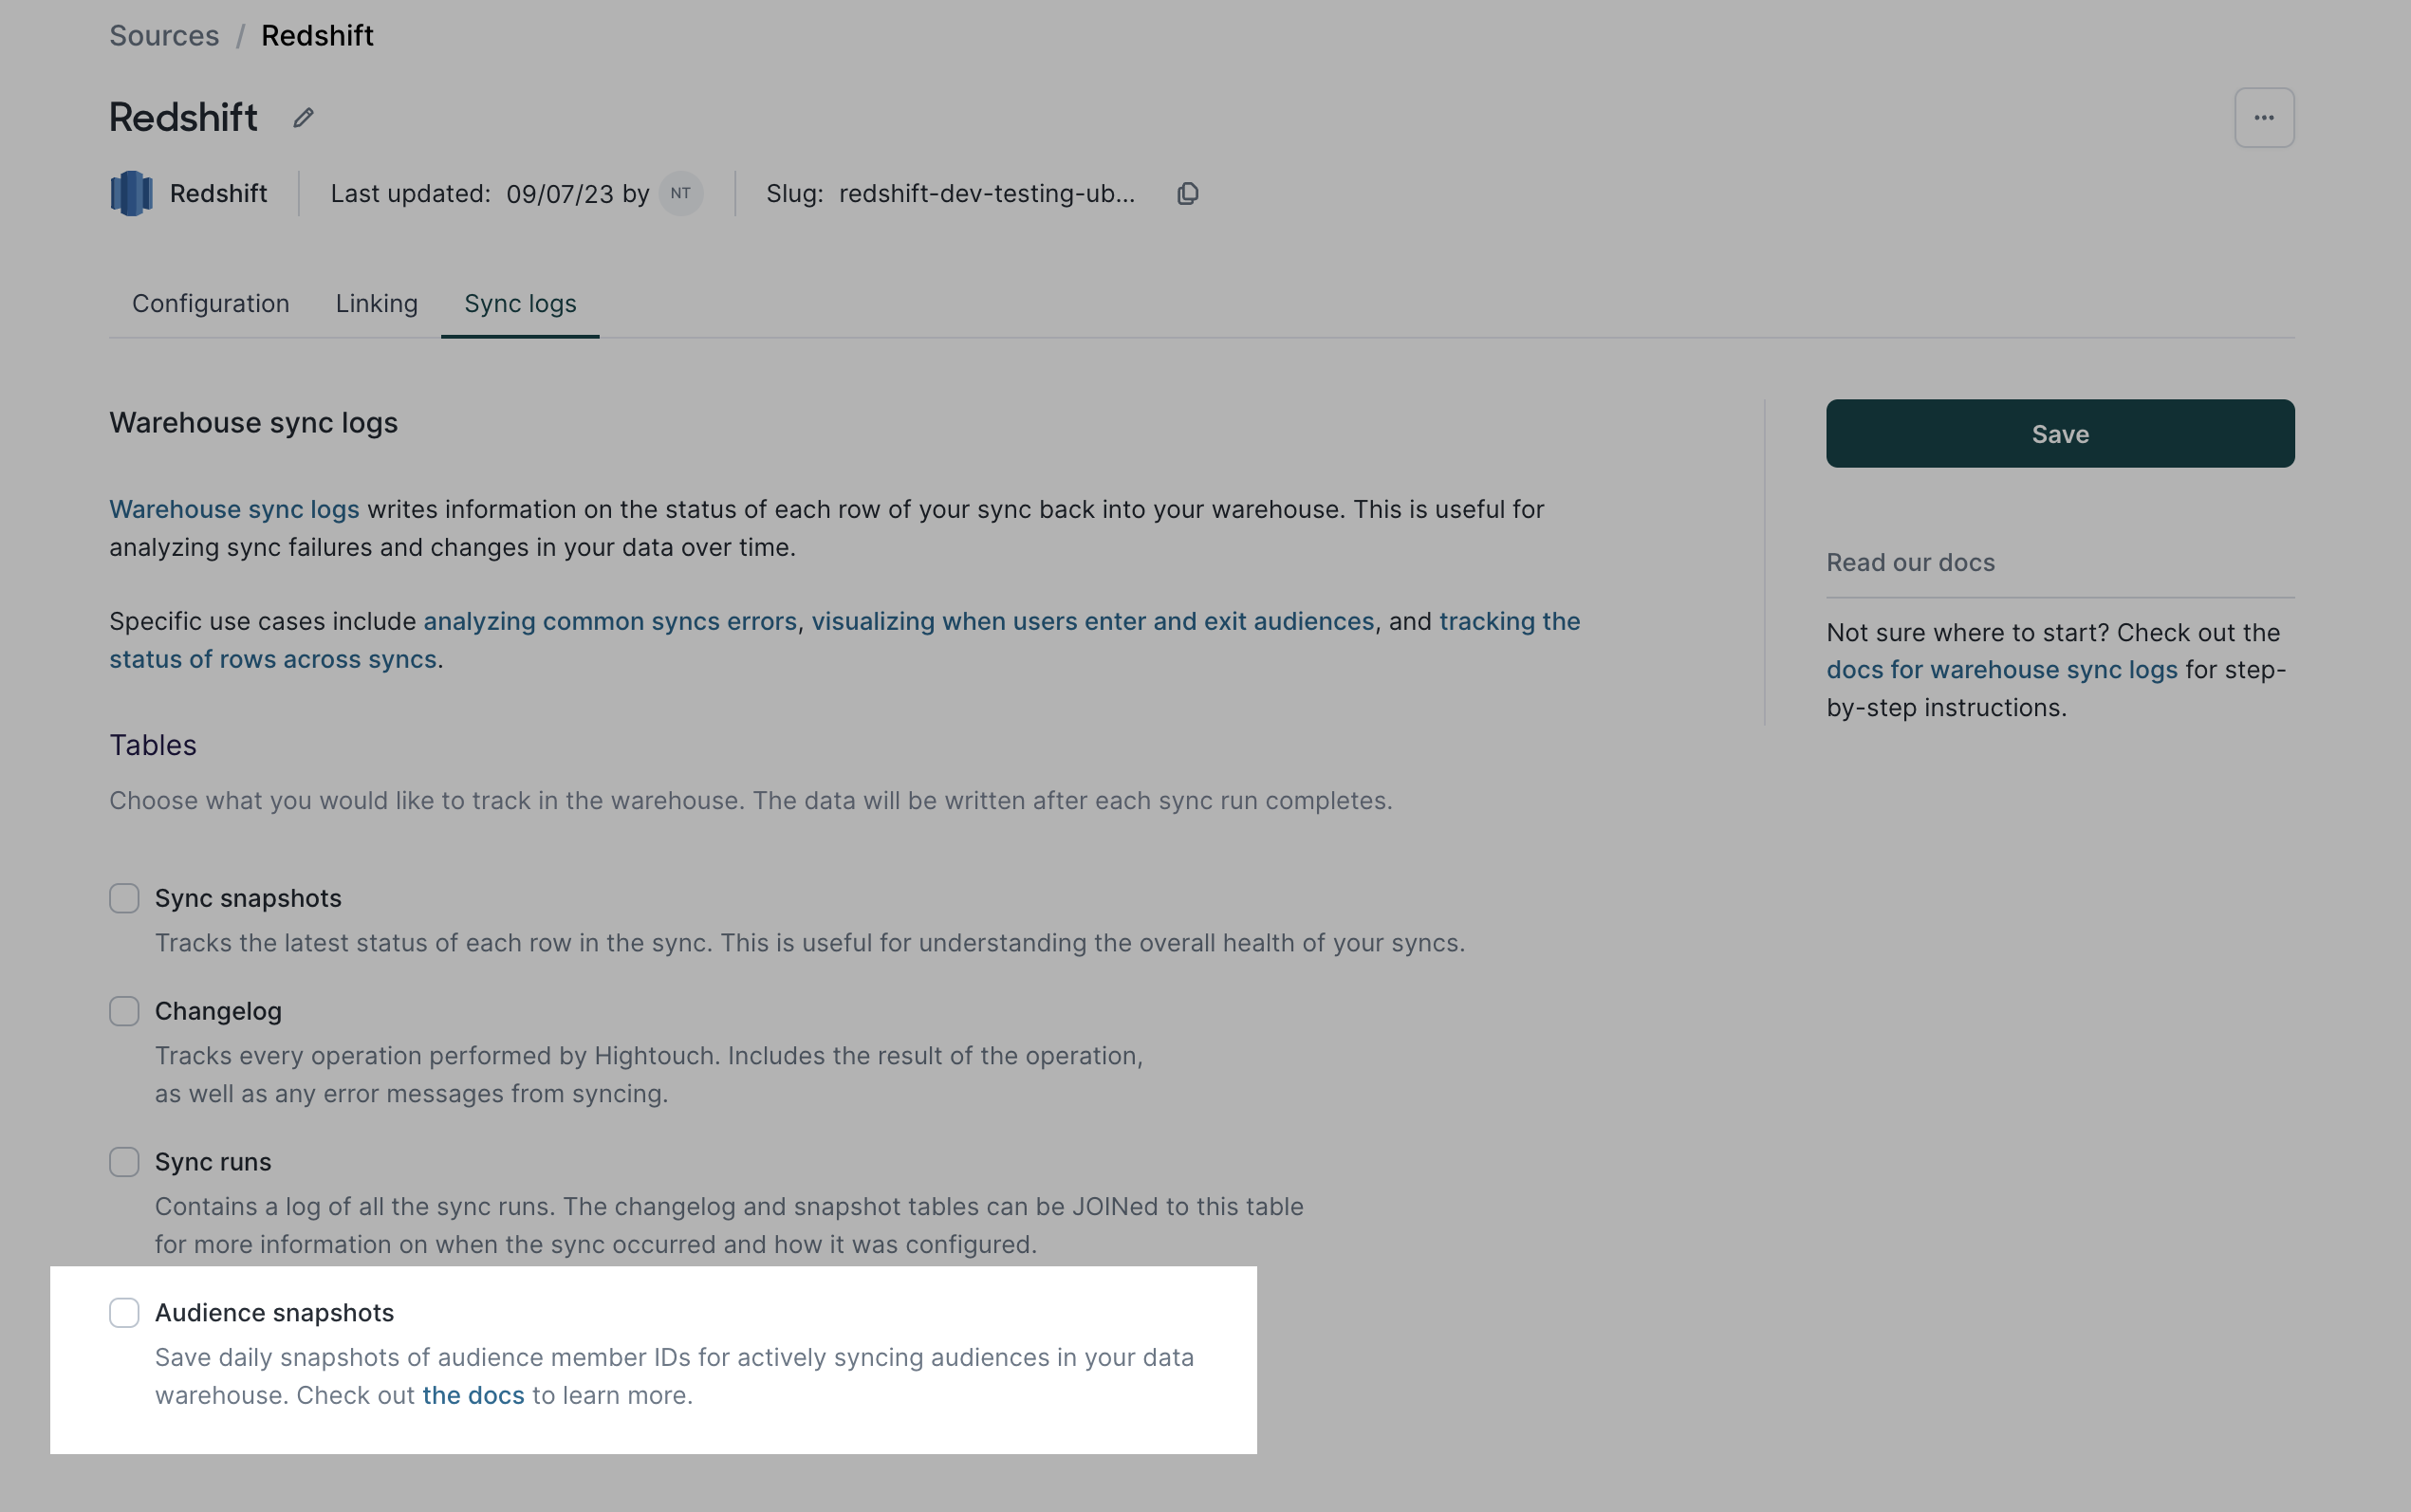
Audience snapshotting is a source-level setting you can turn on from the Sync logs tab in the appropriate source page.
Audience snapshots
Audience snapshotting requires WRITE permissions to your data warehouse.
Because of this, Hightouch only takes snapshots of audiences built off sources that have the Lightning sync engine enabled.
Audience snapshots provide a record of membership history over time. After each sync of an audience, snapshotting sends the IDs of audience members to a table in your data warehouse. The snapshots don't contain any customer data beyond audience members' IDs.
Each table row contains the audience member's ID, the timestamp of when the snapshot occurred, and either an enter or exit event type.
An audience's first snapshot records current membership in the form of enter events for every member.
Subsequent snapshots only contain changes to membership—either enter events for new members or exit events for members who aren't present in that snapshot but were in the previous one.
Snapshots for all audience members in all audiences are stored in a single table called hightouch_planner.audience_membership with the following schema:
| Column | Type | Description |
|---|---|---|
| ht_row_id | string | The primary key of the user. This is stringified for consistency if the underlying type isn't a string. |
| ht_audience_id | string | The ID of the audience. |
| ht_timestamp | timestamp | The time at which the user entered or exited the audience. |
| ht_event_type | string | enter or exit depending on the type of event recorded. |
| ht_split_group | string | The split ID that this user is a member of. If the audience doesn't have splits, the column value is null. |
Define a metric
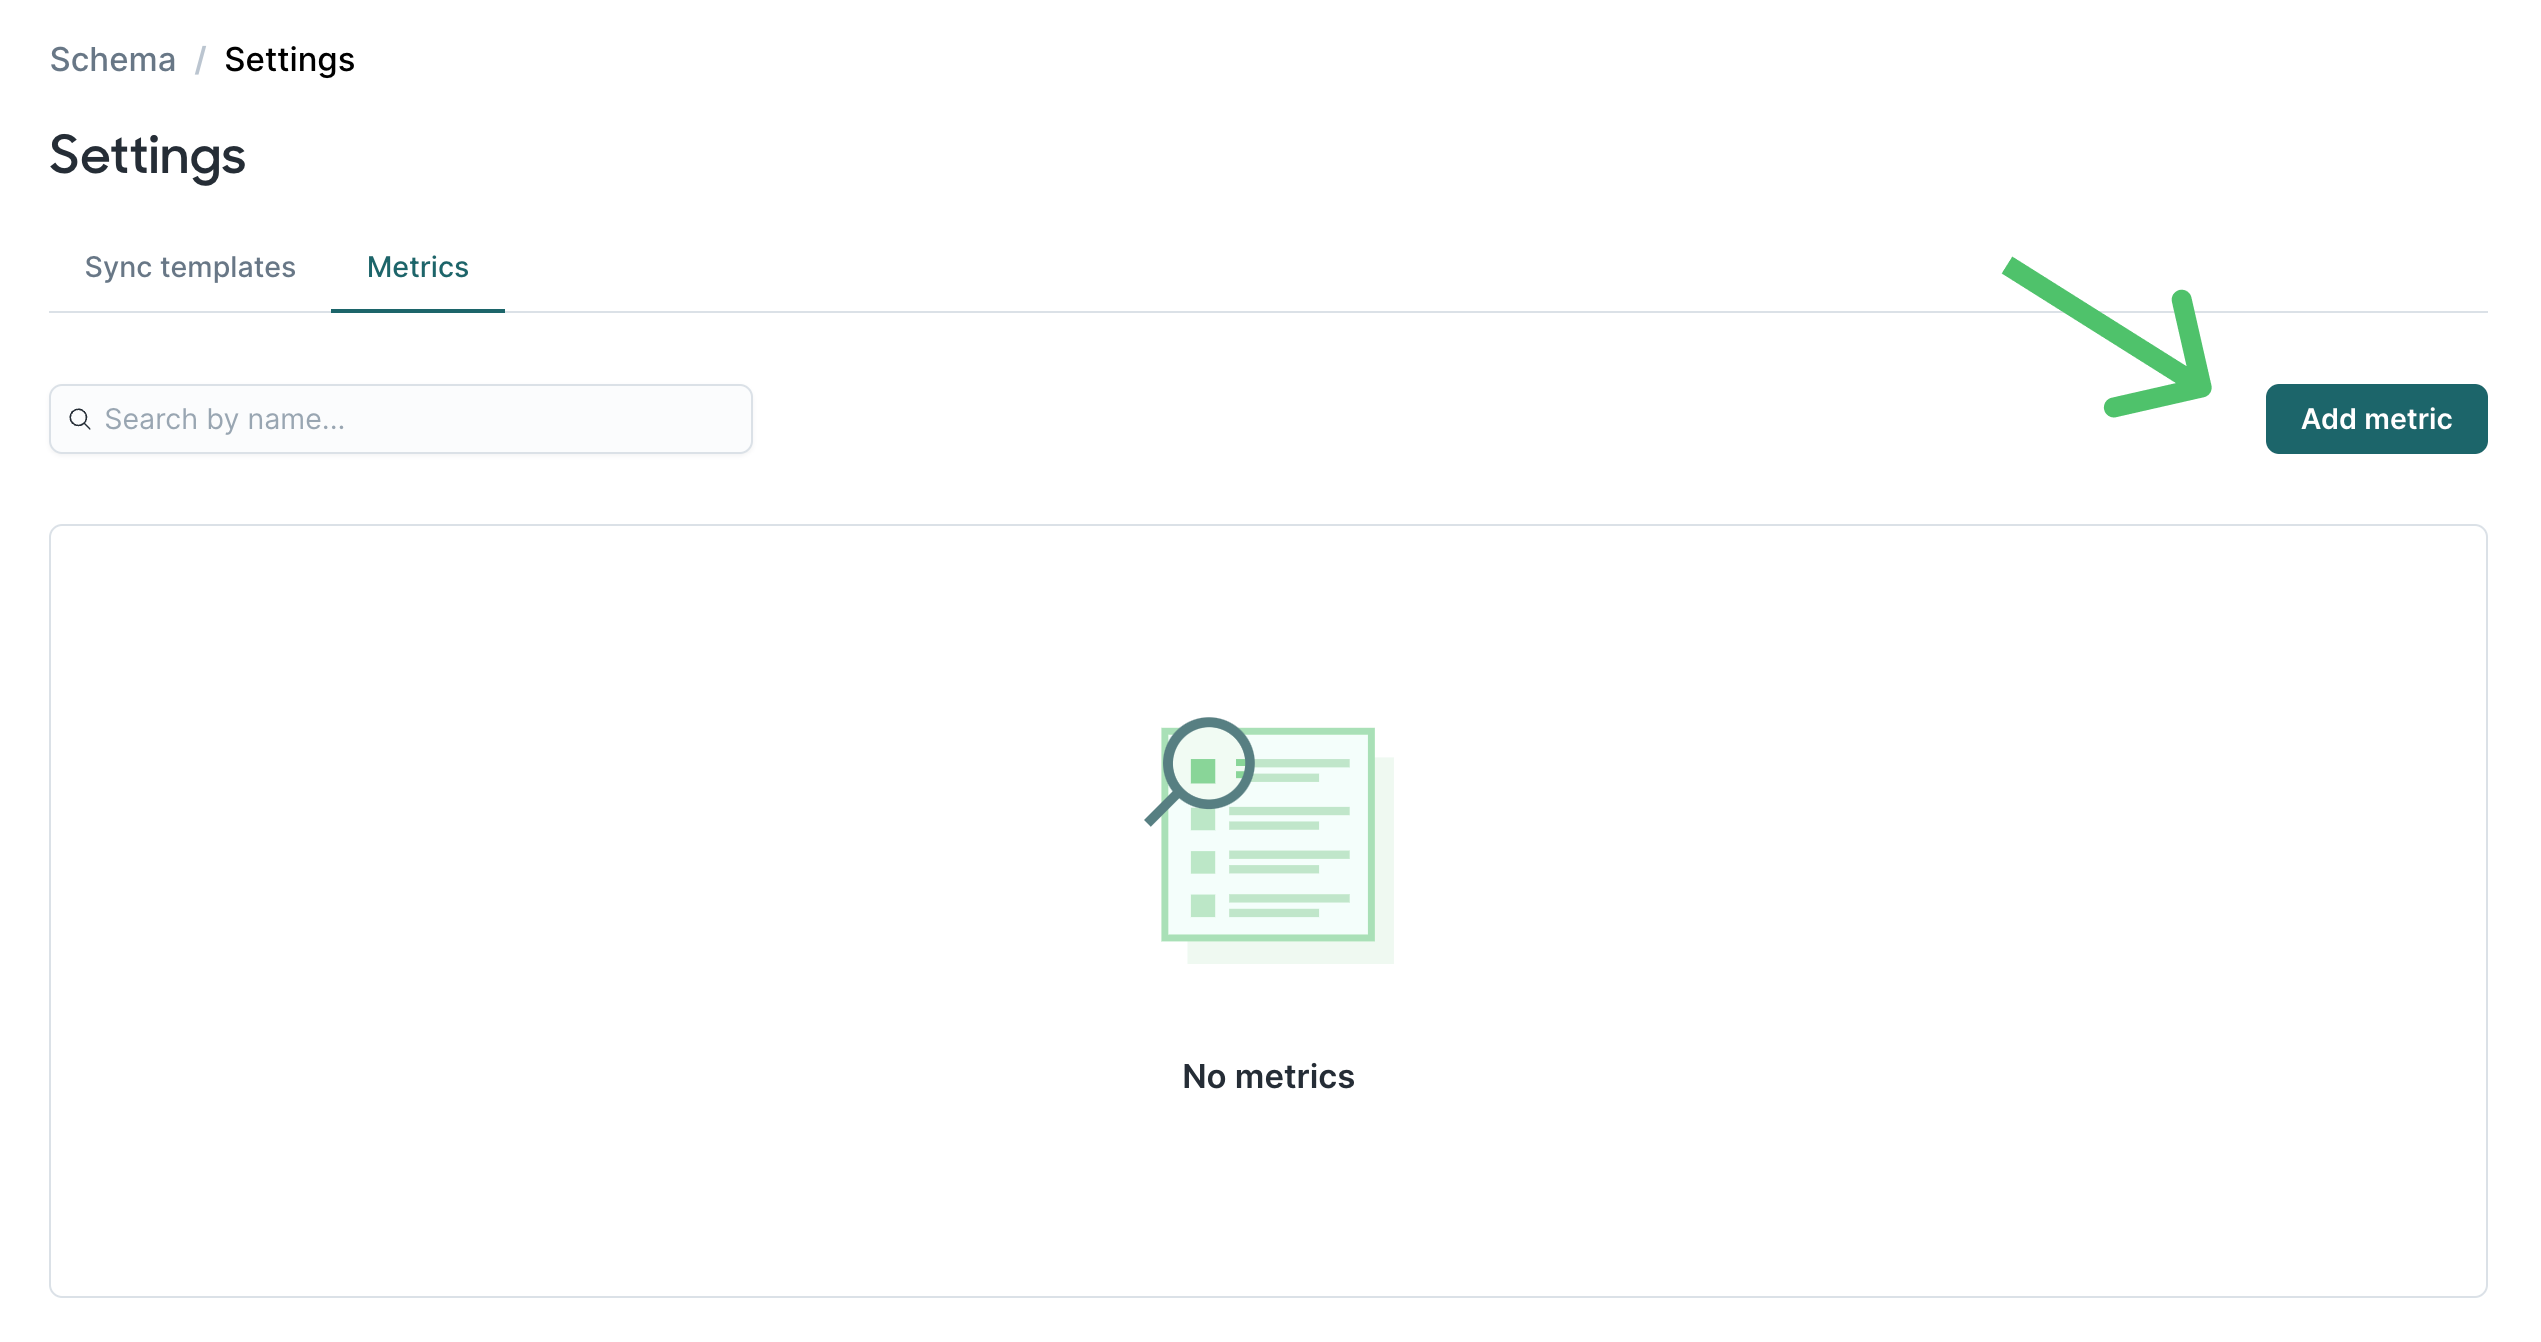
To define a metric:
- Go to the Analytics page and click Manage metrics. This takes you to the Metrics tab, where you can click Add metric.
- Select the Parent model to which the metric should belong.
- Select the Event in your schema that this metric should track.
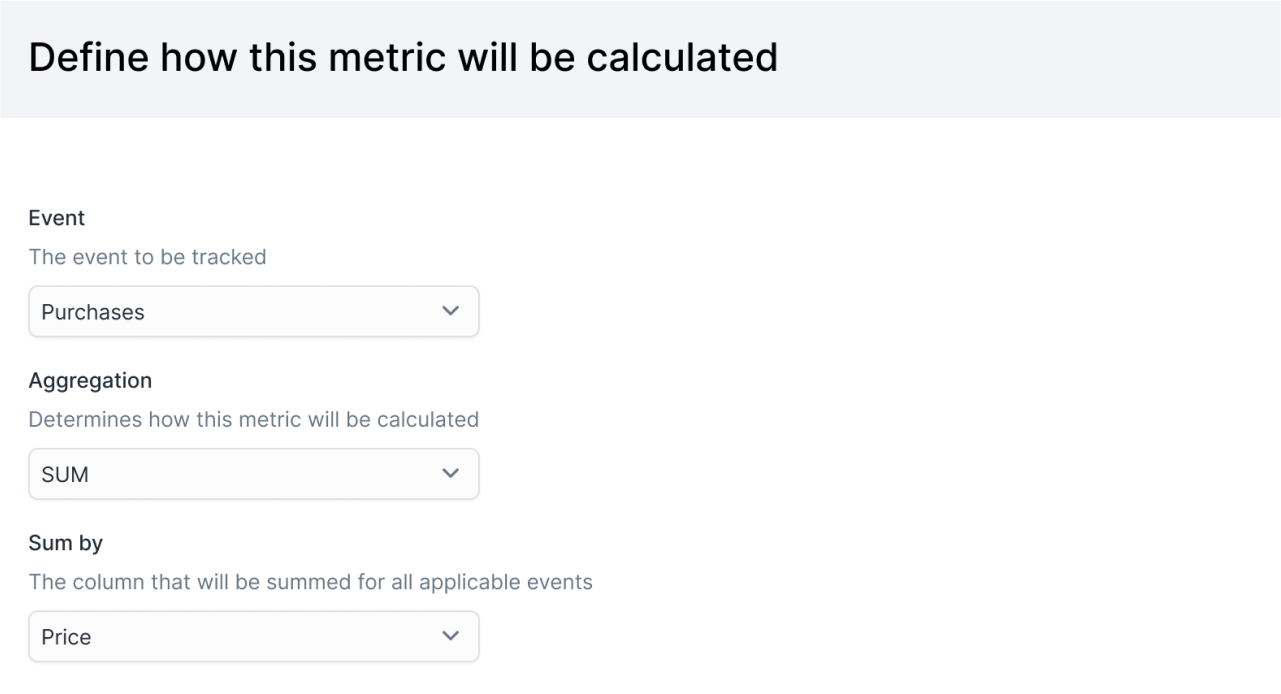
- Select the metric's Aggregation type, for example
SUMorCOUNT. - If you choose
SUM, you need to select which event column to Sum by. For example, for a revenue metric, you may want sum by the price column on purchase events. - (Optional) Add any relevant filter conditions so the metric only tracks certain instances of an event. The image below defines a metric that tracks all purchases where the brand is "Nike" and the category is "Athletic."
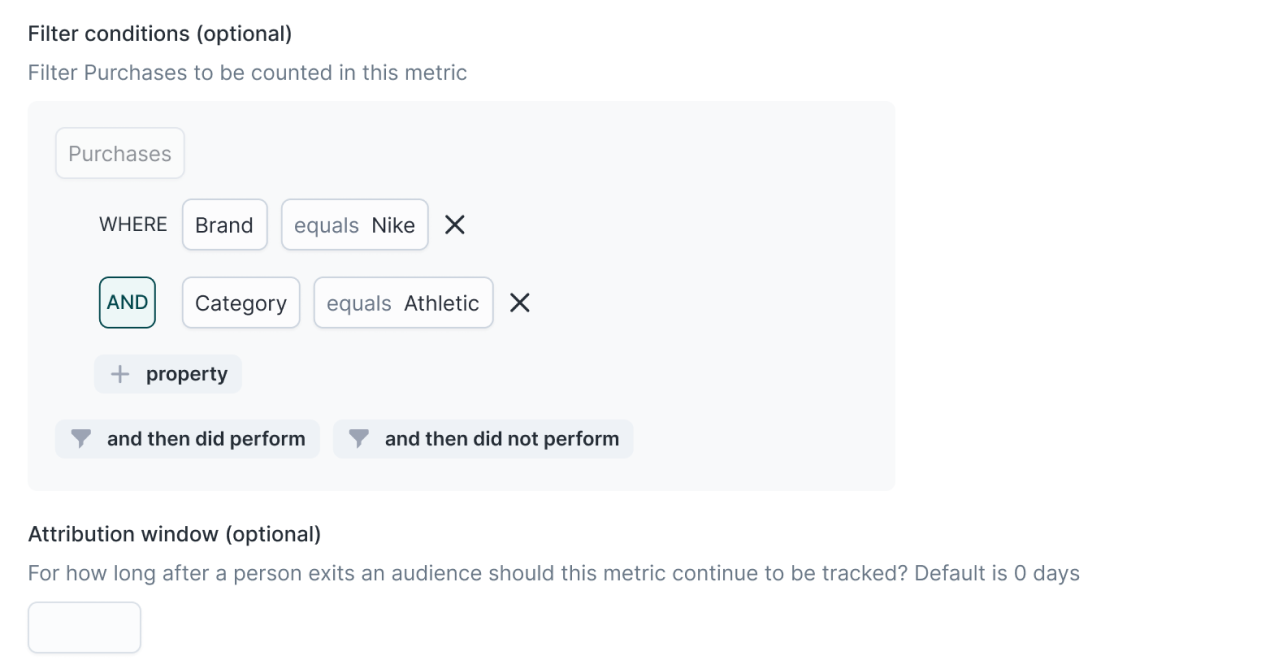
- (Optional) Add an Attribution window. This is the number of days after someone leaves an audience that you still want to count their events in that audience's performance. For example, if you choose an attribution window of five days, a purchase made by a customer three days after they leave the audience still counts towards the audience's performance. The default value is zero. This means that events that occur after an audience member has left an audience aren't part of the metric calculation.
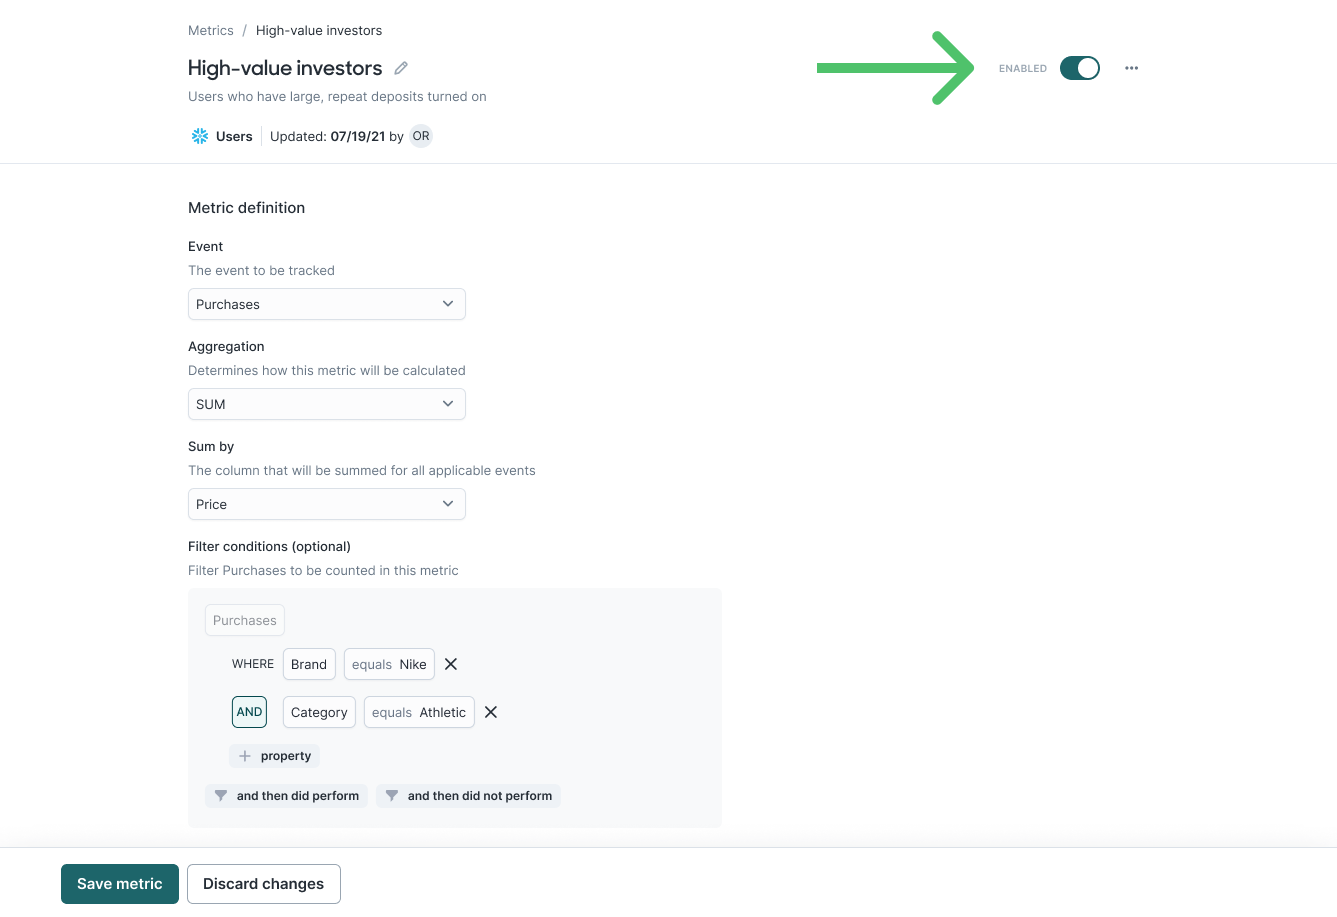
- Give the metric a name and description. Click Save.
- You're taken to the metric's overview page. Once you've created it, the metric is enabled by default. You can always turn it off by using the toggle on the top right of the page.
Enable metrics
To enable metric computations for a specific audience, go to the audience's overview page, open the Performance tab and toggle Enable performance tracking.
For a metric to be available for an audience, the metric must be defined on the audience's parent model.
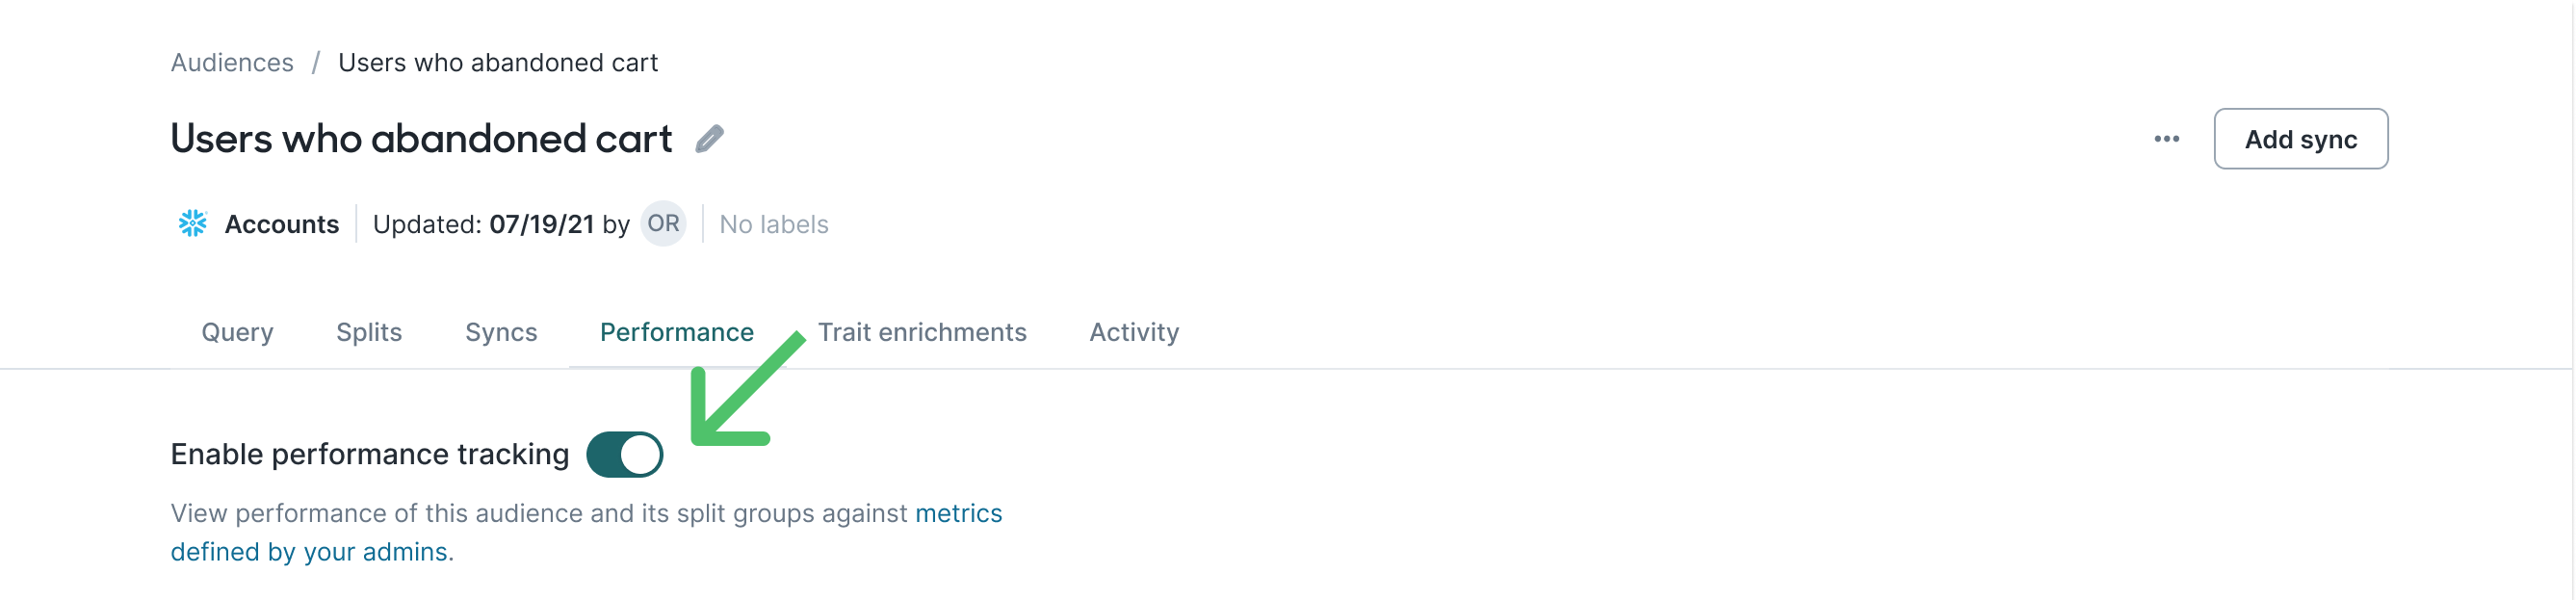
From now on, Hightouch computes enabled metrics for that audience daily, and you can see updated values on the Analytics page.
Hightouch only computes metrics starting from when you enable them. After toggling Enable performance tracking for the first time, it may take up to 24 hours to see data on the performance graphs.
View metrics
Once you've defined and enabled metrics on your audiences, you can view and compare them on the Analytics page or on an audience's Performance page.
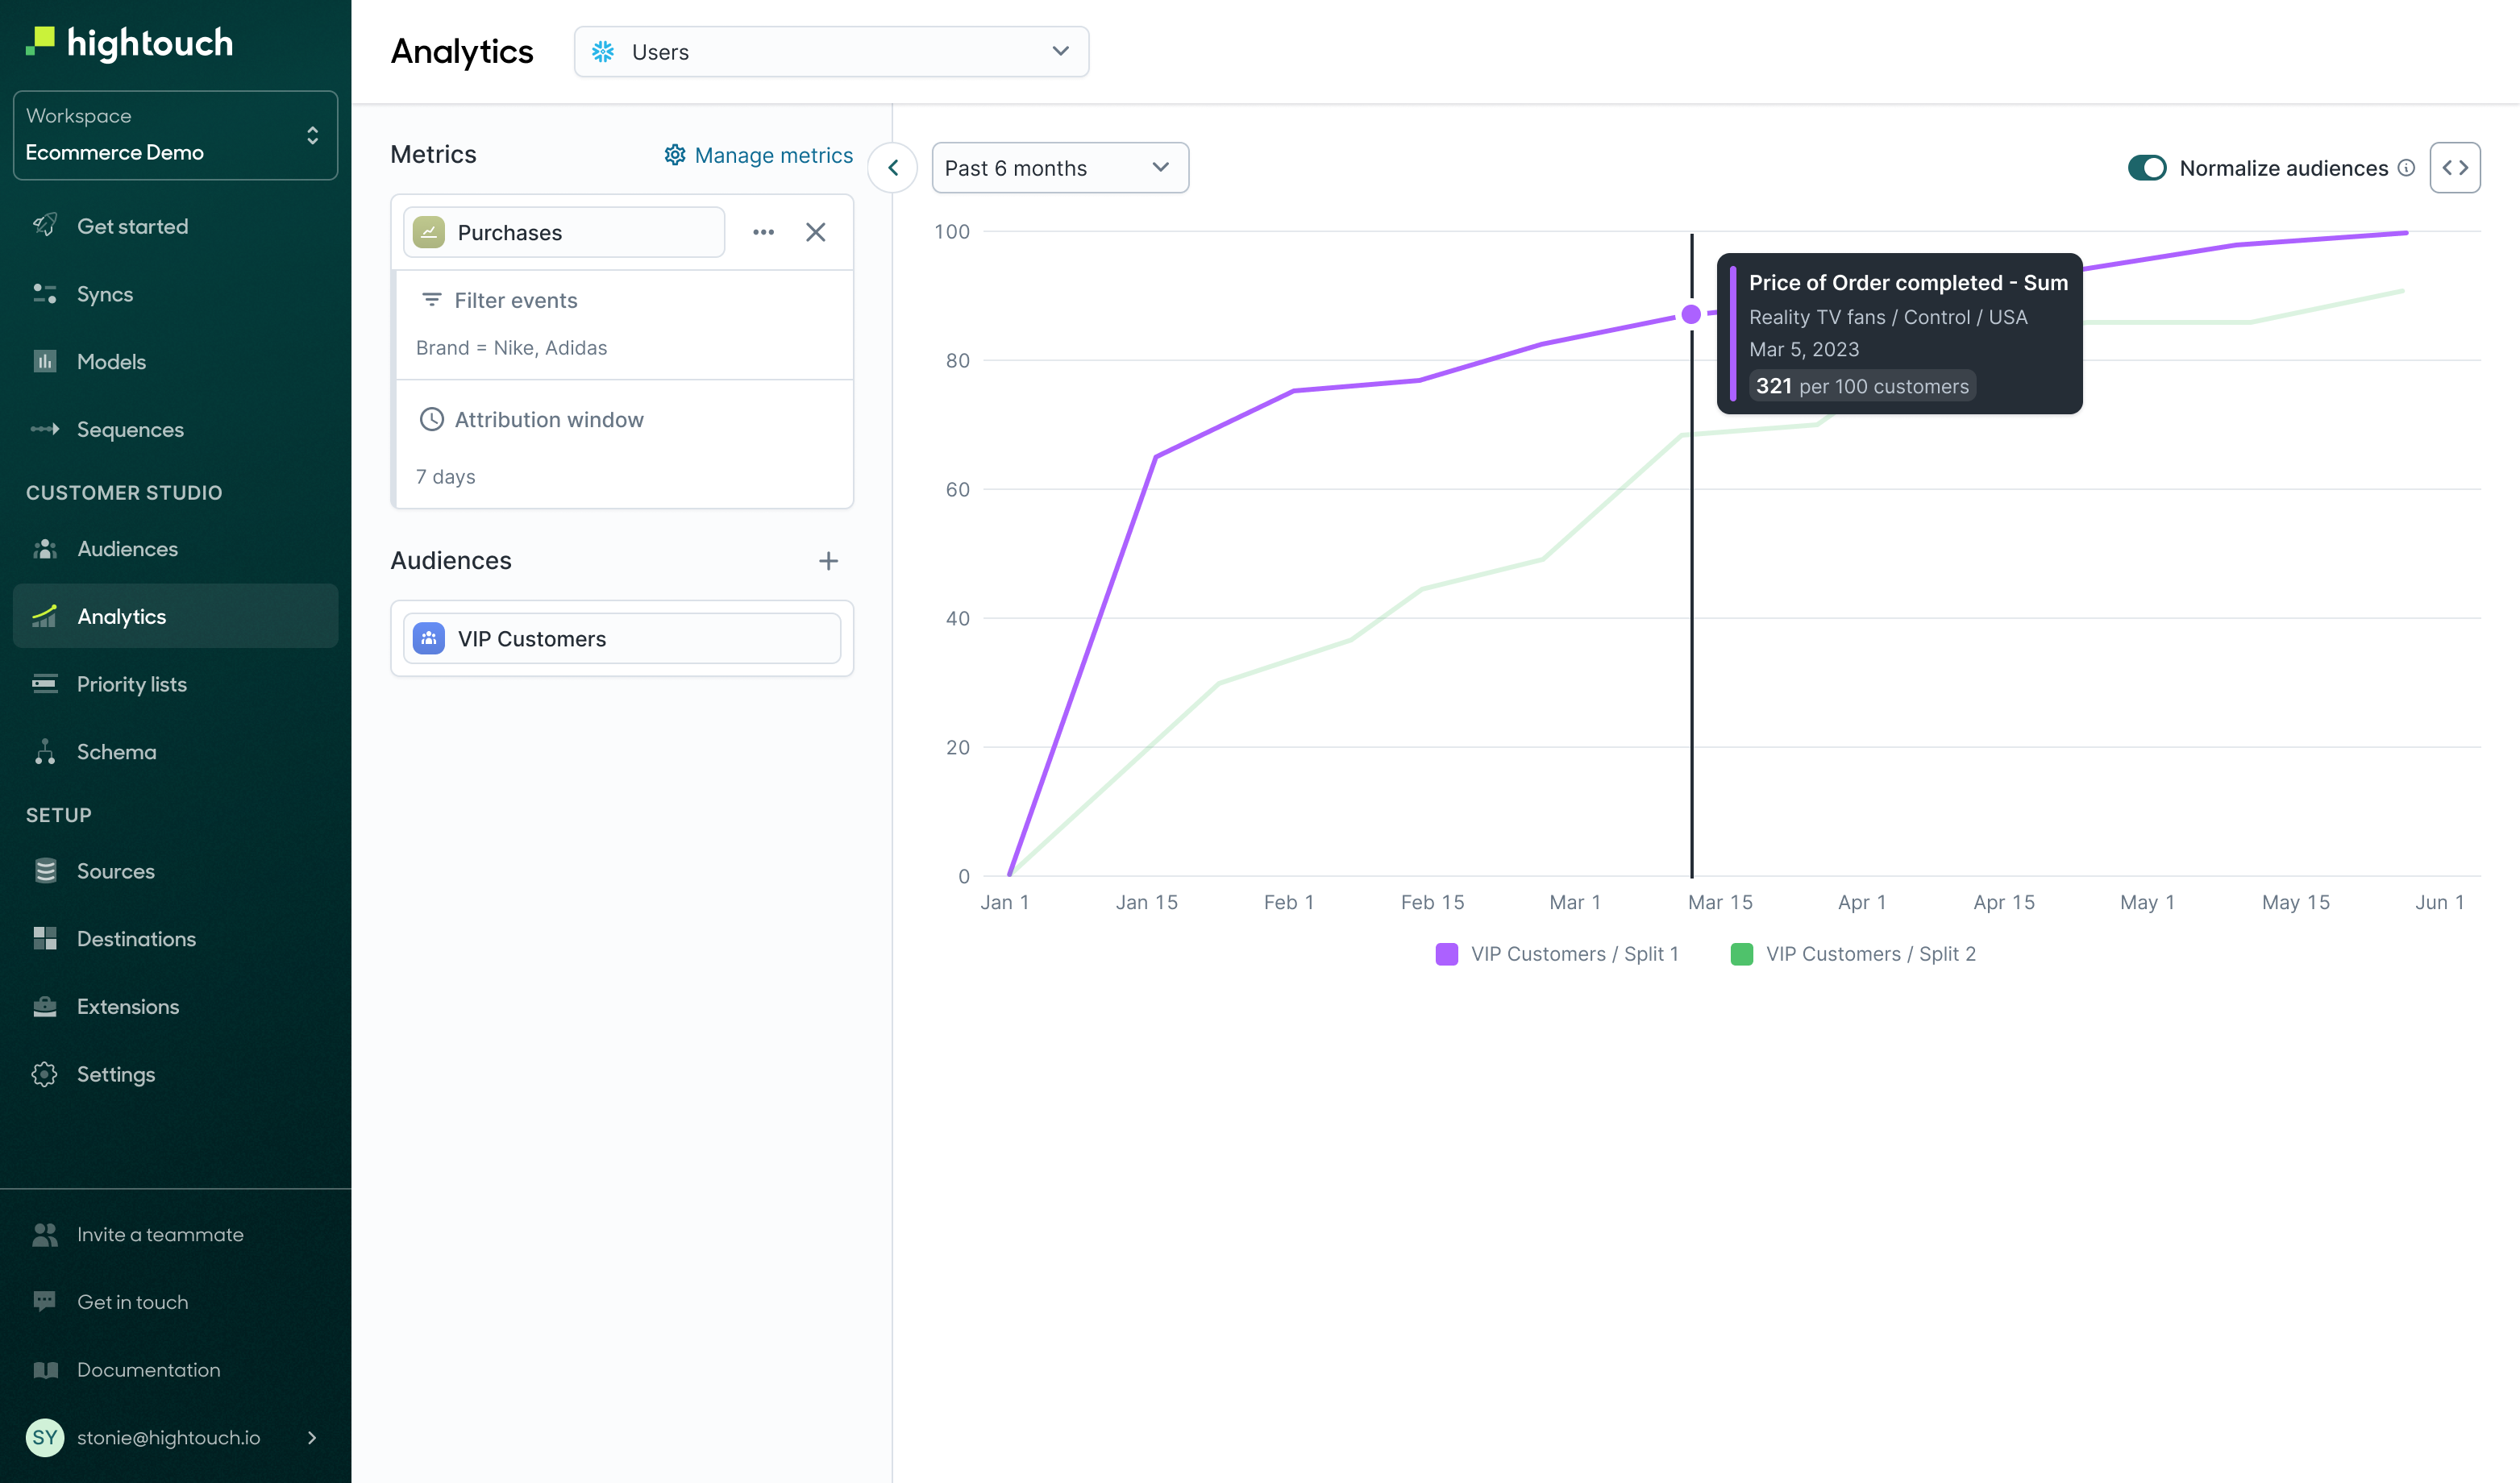
Cross audience comparison
To compare a single metric across multiple audiences:
- Open the Analytics page and select the metric you want to view.
- Select the audiences you want to compare. If an audience has splits, the splits are automatically shown as separate trend lines.
- Turn on Normalize segments if this is helpful. A segment is either an audience or a split group. Normalization divides each segment's metric by its size. This enables a more accurate comparison between different sized audiences and split groups.
- Select the time period you want to compare the audiences for.
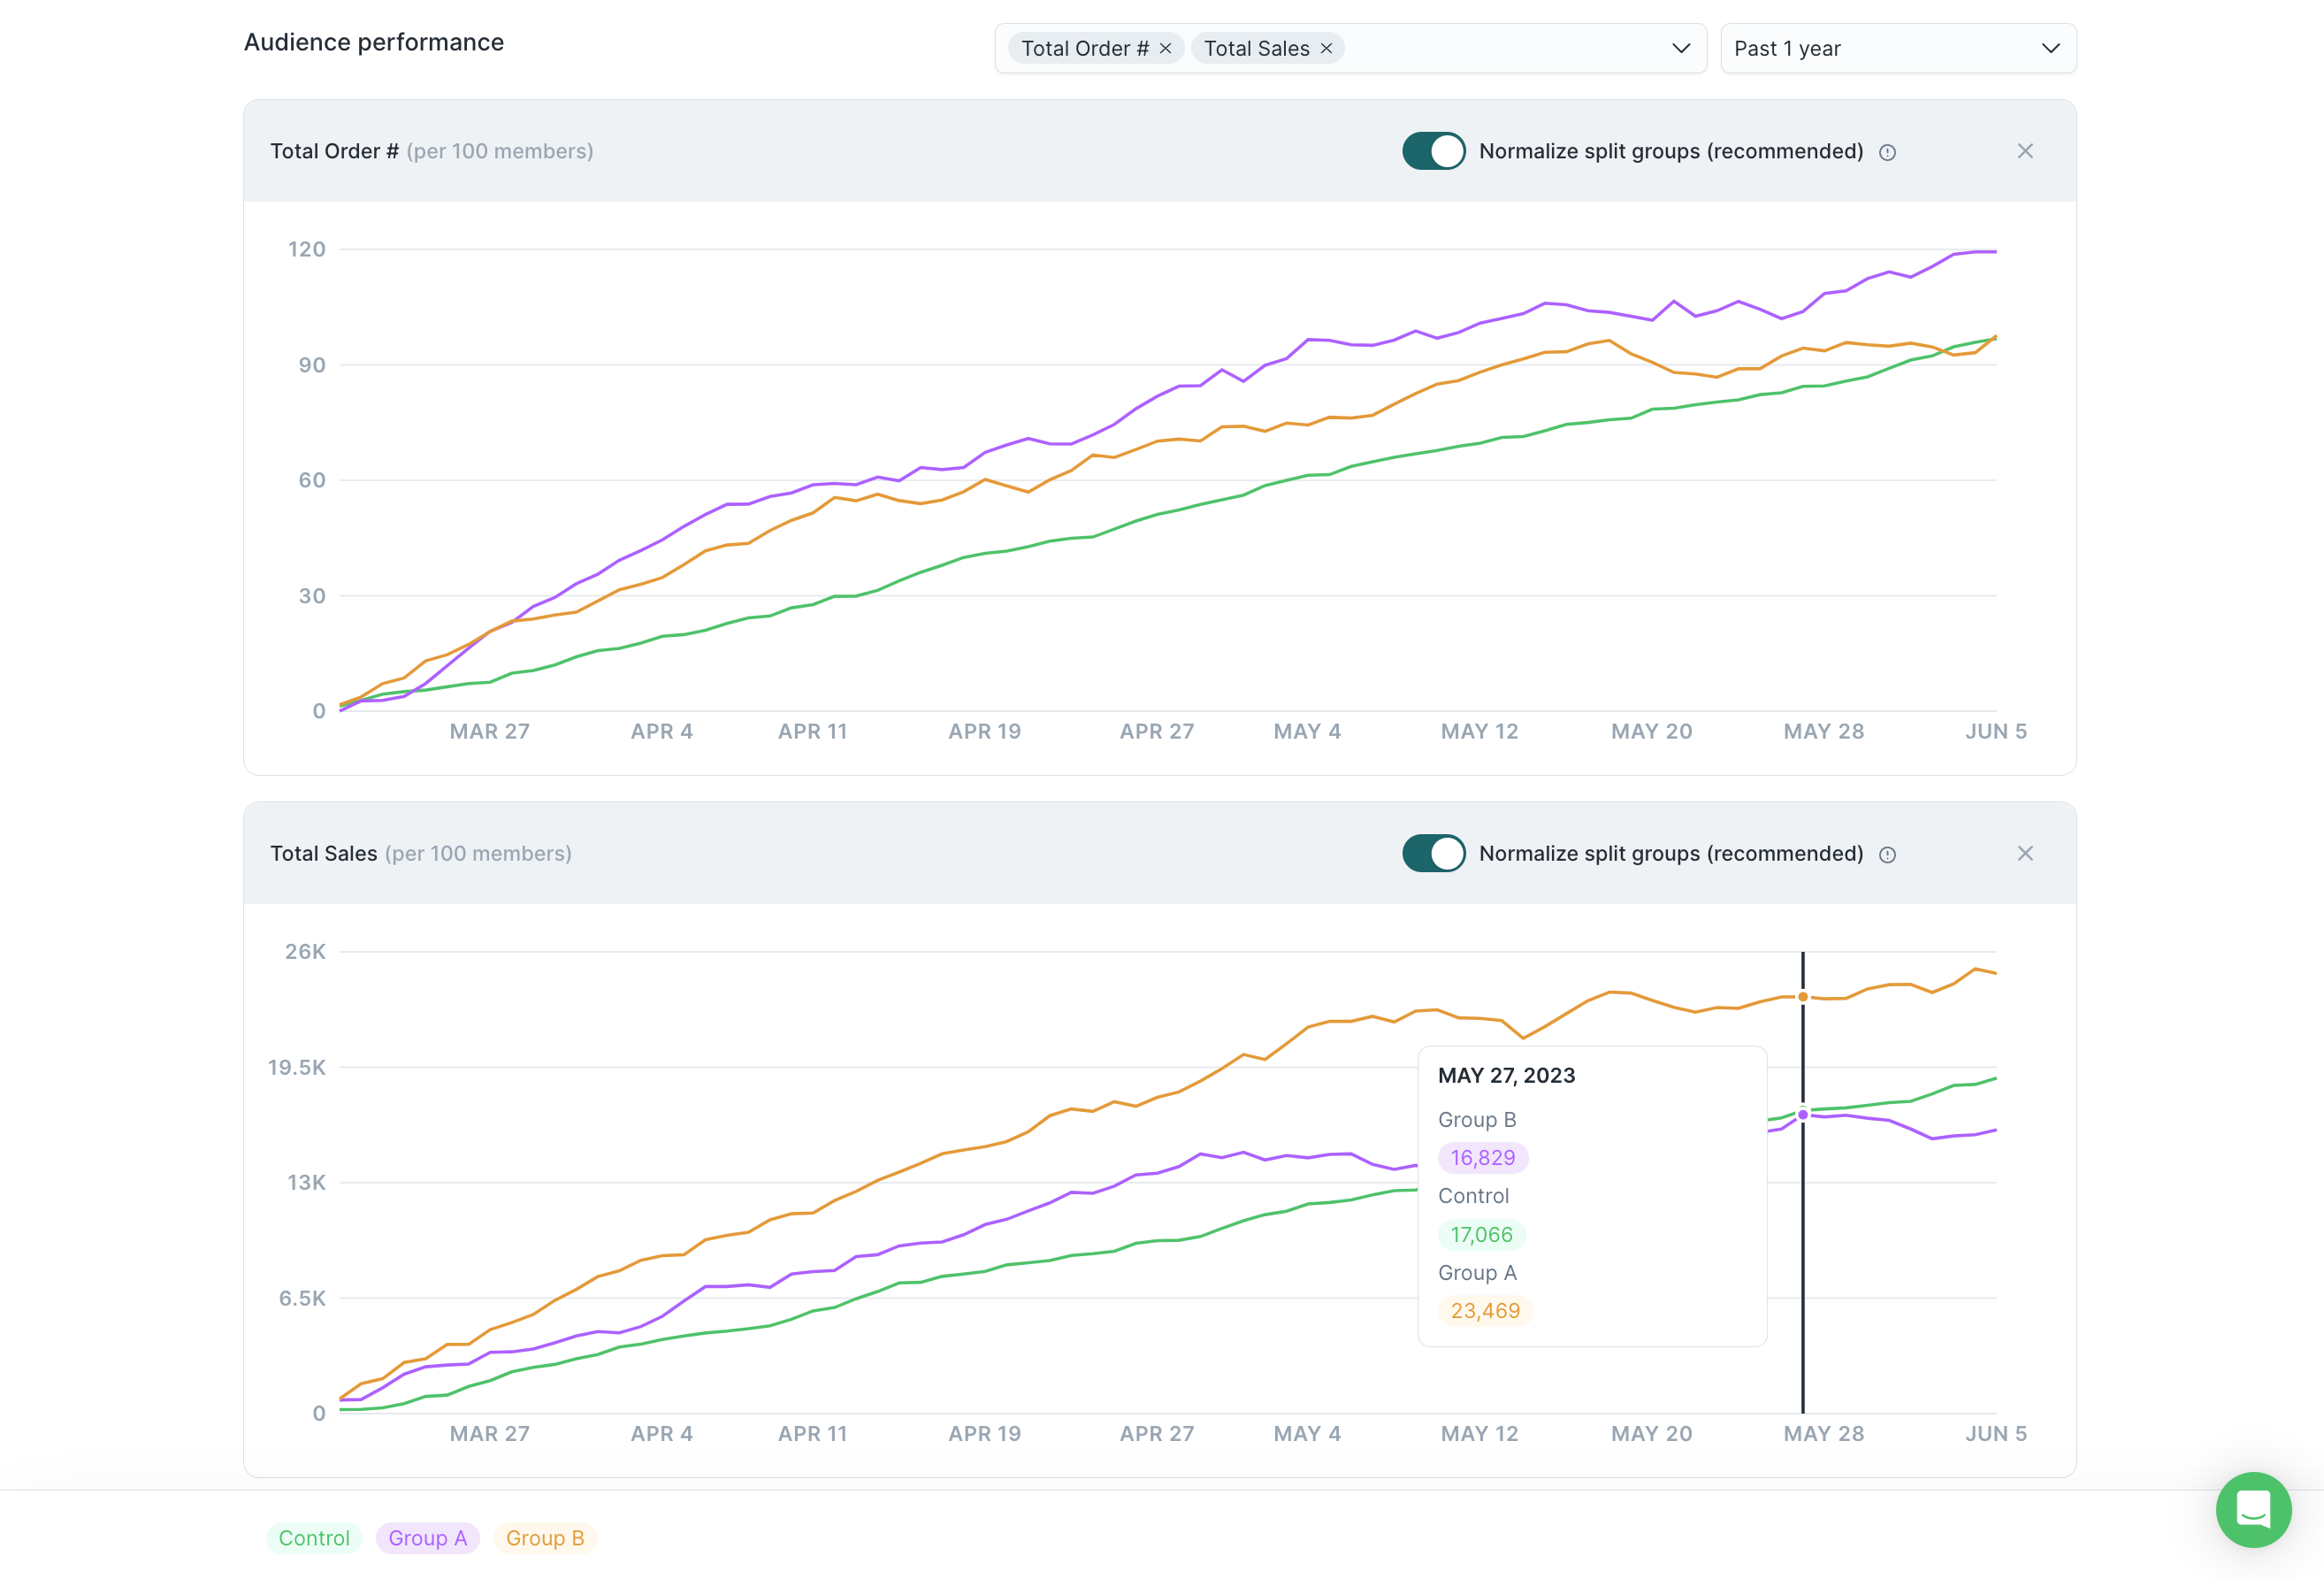
View multiple metrics for one audience
You can view multiple metrics simultaneously for one audience. To do so:
- Go to the audience's overview page and open the Performance tab.
- Select the metrics you want to view. If an audience has splits, the splits are automatically shown as separate trend lines.
- Turn on Normalize split groups if this is helpful. Normalization divides each split group's metric by the split group size. This enables a more accurate comparison between different sized split groups.
- Select the time period you want to view metrics for.
Each metric is shown in its own time series graph.